
GEEK Energy
A live, read-only view of your electrical system. GEEK Energy reads the meters, PLCs and generator controllers in your panels and shows what is happening in terms your facility team can act on.
Start with the essentials
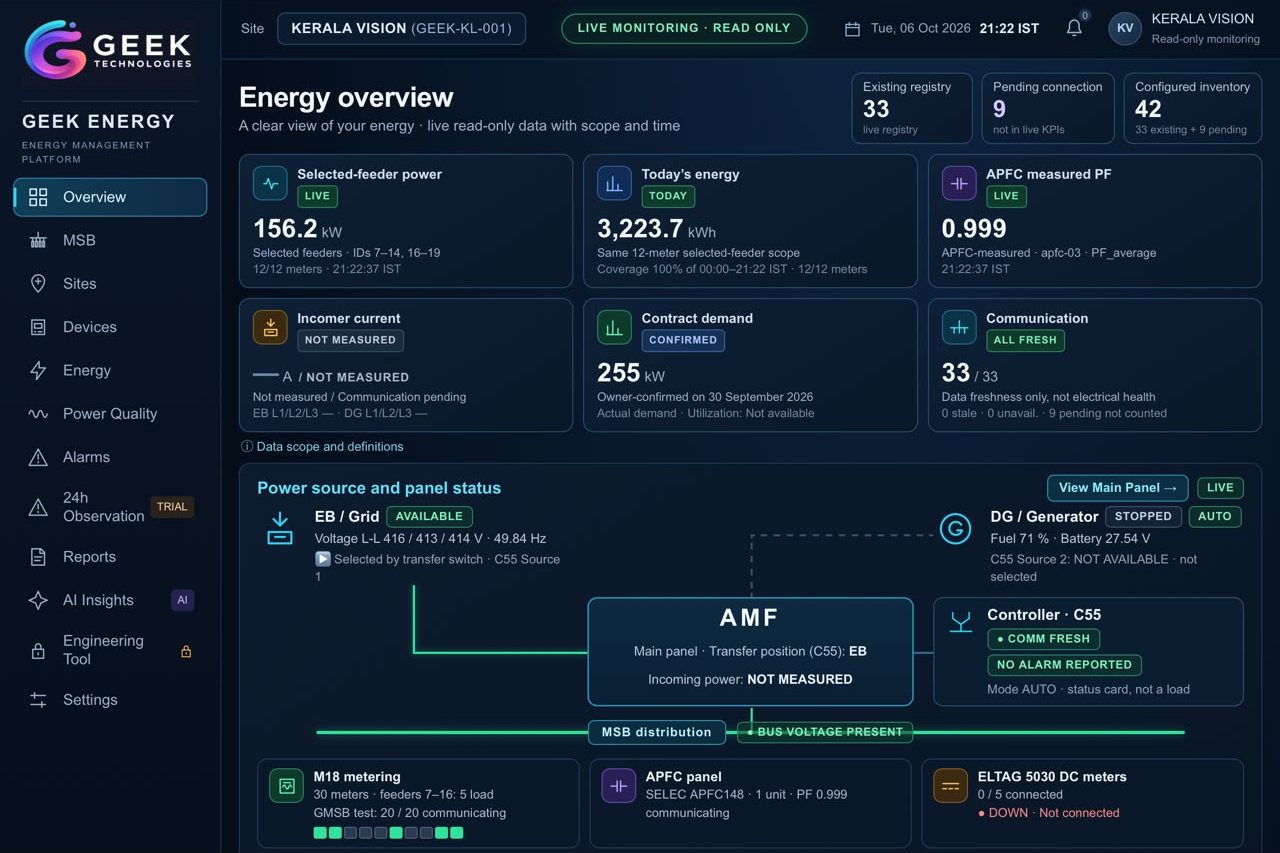
The overview brings power, energy, power factor, communication health and source status onto one screen.
- Live kW, today's kWh and measured power factor
- Grid and generator availability and the selected source
- Status of AMF, APFC and metering panels
- Clear marking of what is measured and what is not
See readings in their electrical context
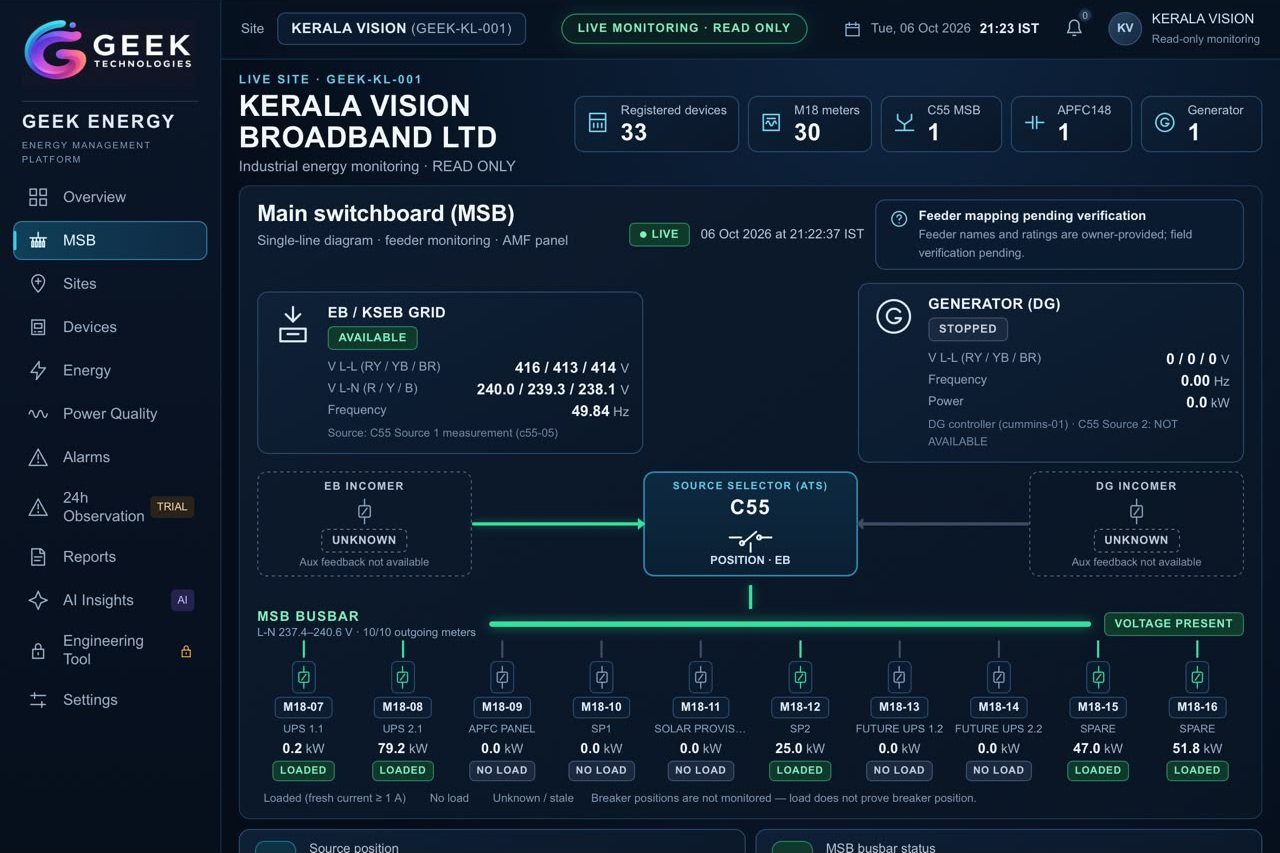
The single-line view places every reading on a drawing of your switchboard: sources, changeover, busbar and each outgoing feeder.
- Grid and generator voltage and frequency
- Source selector position reported by the controller
- Load on each metered outgoing feeder
- Breaker positions shown only where feedback is wired
What the platform includes
Each site is configured to the panels and devices actually installed. Typical modules:
Overview
Key power, energy and power-factor figures with source and panel status.
Electrical single-line view
Switchboard, synchronising panel and feeder layout with live readings.
Device readings
Phase-by-phase voltage, current, power and energy for every meter.
Energy history
Consumption by hour, day, month and year, with data coverage shown.
Power quality
THD and harmonic orders where meters support them, viewed alongside load.
Generator and controllers
DG mode, engine state, alarms and PLC feedback in one place.
Multi-site view
All your locations and their communication health on one screen.
AI insights
Ask questions about your data and get answers that cite the readings used.
Engineering tools
Structured review of harmonics, reactive power and meter consistency.
How it works
GEEK Energy reuses the instruments you already have wherever possible.
Connect
An edge gateway at site reads meters, PLCs and DG controllers over Modbus RS-485 or Ethernet.
Check
Every reading is time-stamped and checked for freshness, so stale or missing data is never shown as live.
Record
Measurements are stored as history for trends, reports and engineering review.
Present
Dashboards on desktop, iPad and phone, with remote access set up securely.
GEEK Energy is a monitoring system. It reads data and does not switch breakers or start generators. The scope of each site, including which panels and devices are covered, is agreed and verified during commissioning.
Who uses GEEK Energy
Facility managers, maintenance teams and engineering consultants at hospitals, IT parks, telecom and broadband operators, factories and commercial buildings.
Book a demo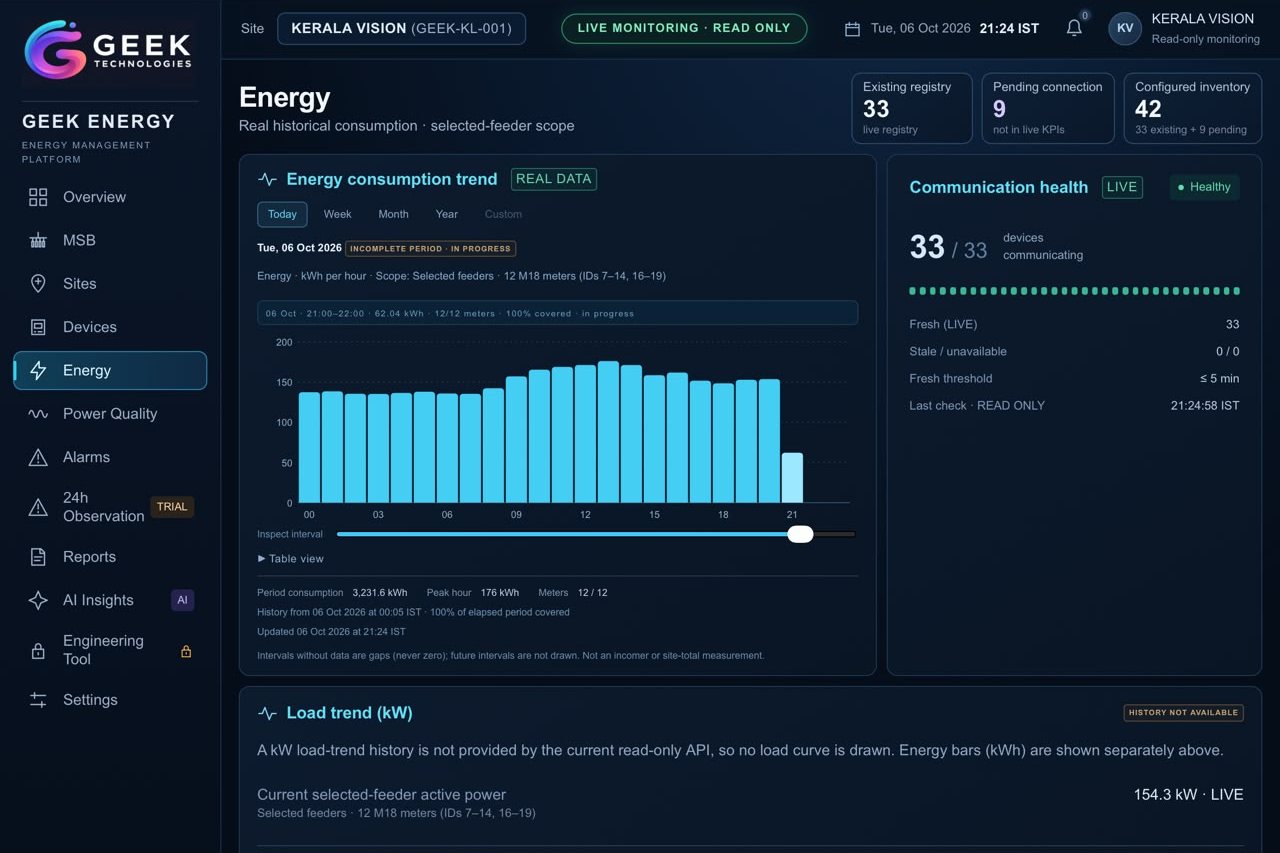
Talk to an engineer
Office +91 98466 40888 · Mobile +91 90613 40777 · admin@geekneo.com